University Project FH Potsdam, Design Research in Interfacedesign
Year 2020
Tasks My focus was first on the conceptual part of the content, infografics as well as layout and later on the whole development/coding of the scrollytelling website, published with GitHub Pages.
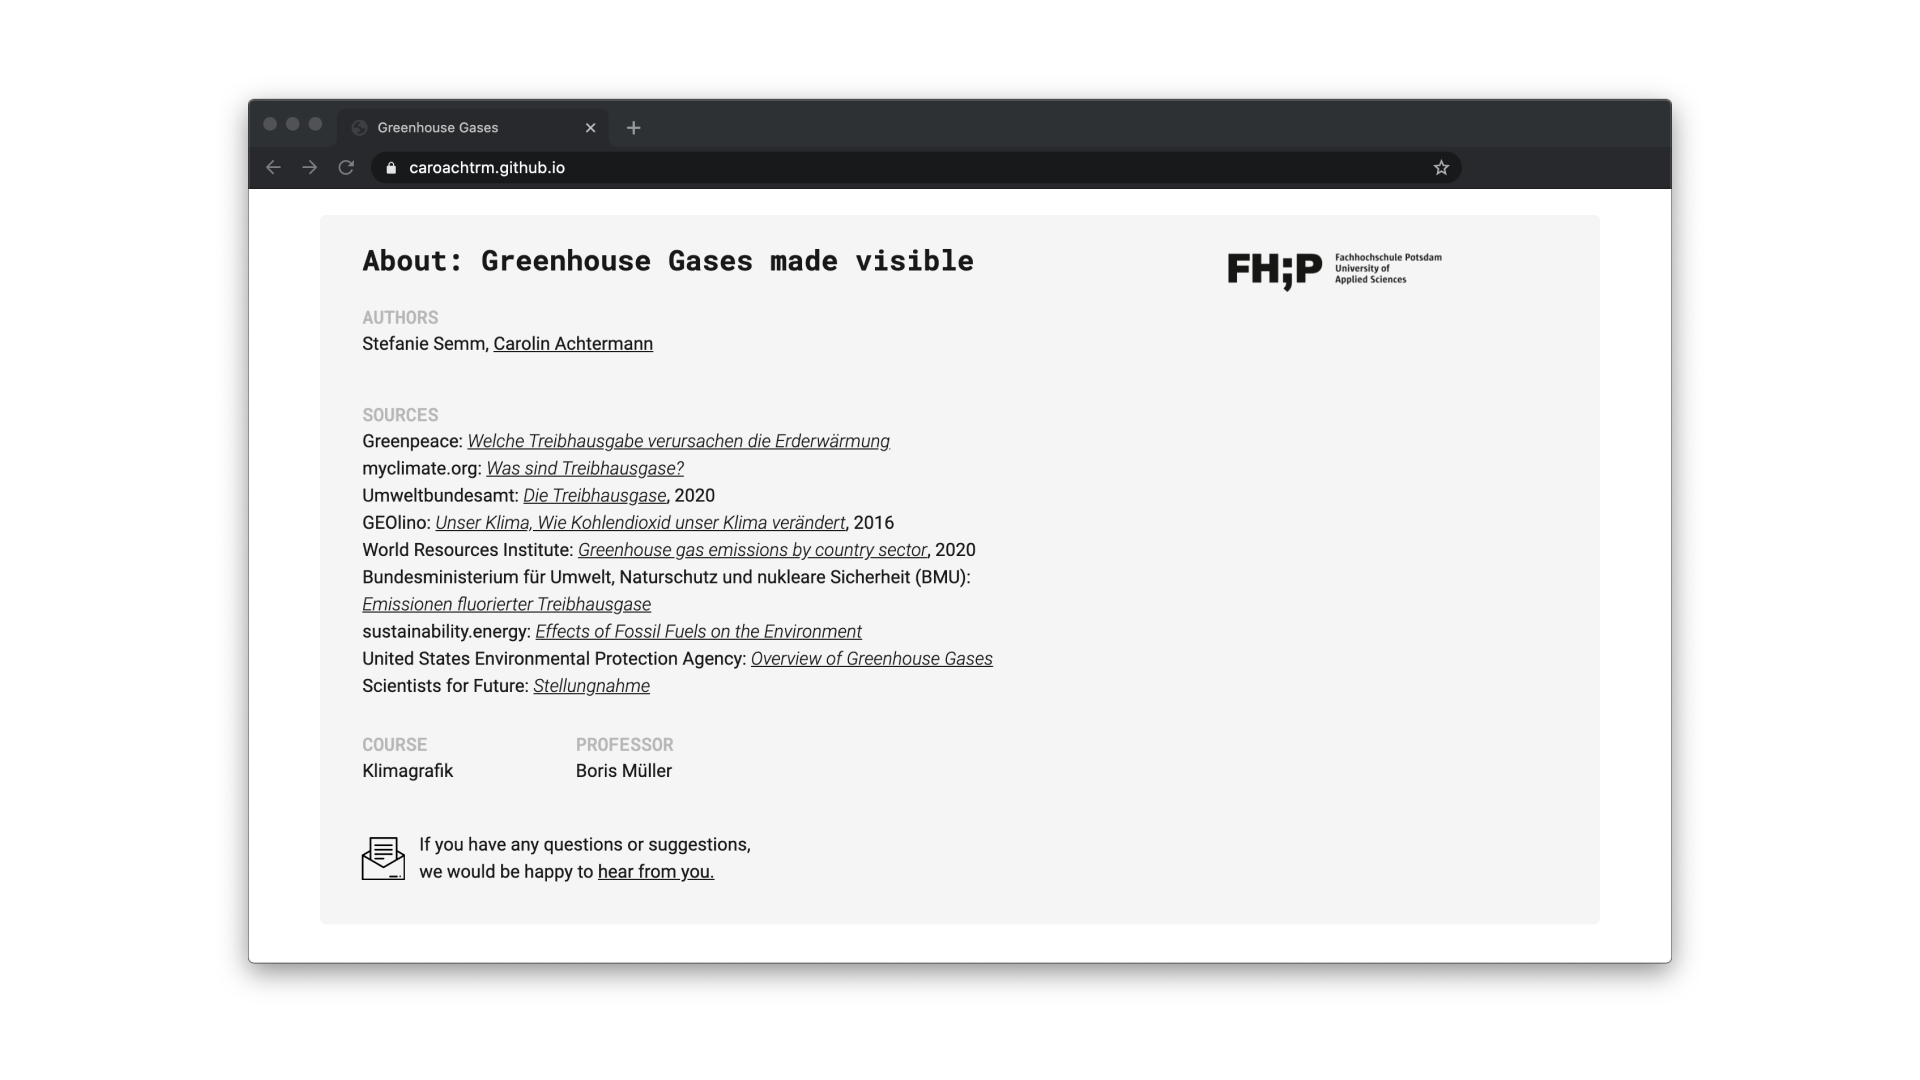
Team Stefanie Semm
Climate change is one of the major global challenges of the 21st century and an important aspect of combating climate change is education as well as information. It is necessary to show how the climate has already changed over the last 250 years, how the climate is likely to change, which factors influence the climate and how human activity affects the climate.
Our project was part of the course „Klimagrafik“, in which we developed infographics that illustrate and communicate ecological, economic, physical and social aspects of global warming. The infographics are published in the form of a website. The aim is to inform and educate about different aspects of climate change.
This course was also part of the digital semester through Covid-19 and the associated contact restrictions, which meant no possibility to learn and work in one place on campus. Therefore the whole process with creative work, all feedback sessions and presentations were conducted via Zoom, Teams, Mail, GoogleDocs, Miro, Incom, Figma, GitHub and Keynote.
TOPIC
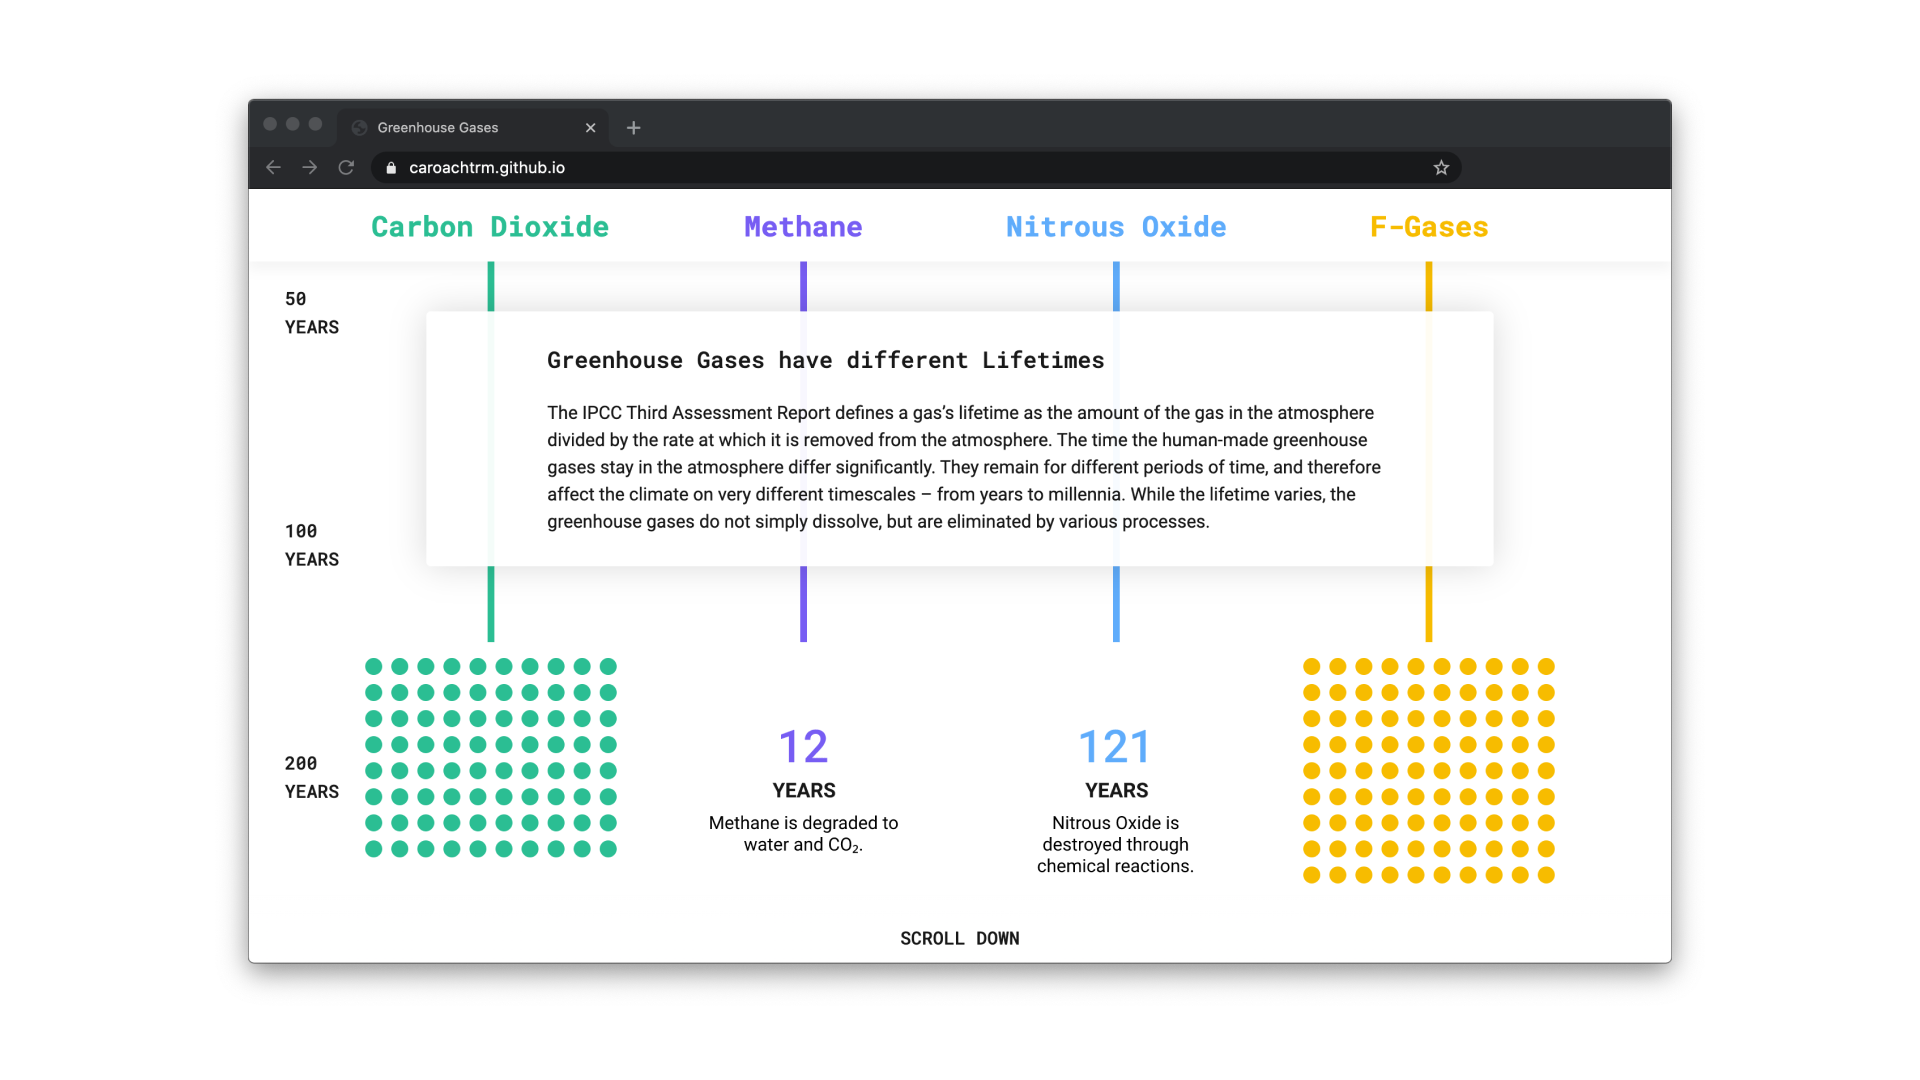
What is the difference between the human-made greenhouse gases CO₂, Methane, Nitrous Dioxide and F-Gases? // How long will they stay in the atmosphere? // What is CO₂eq?
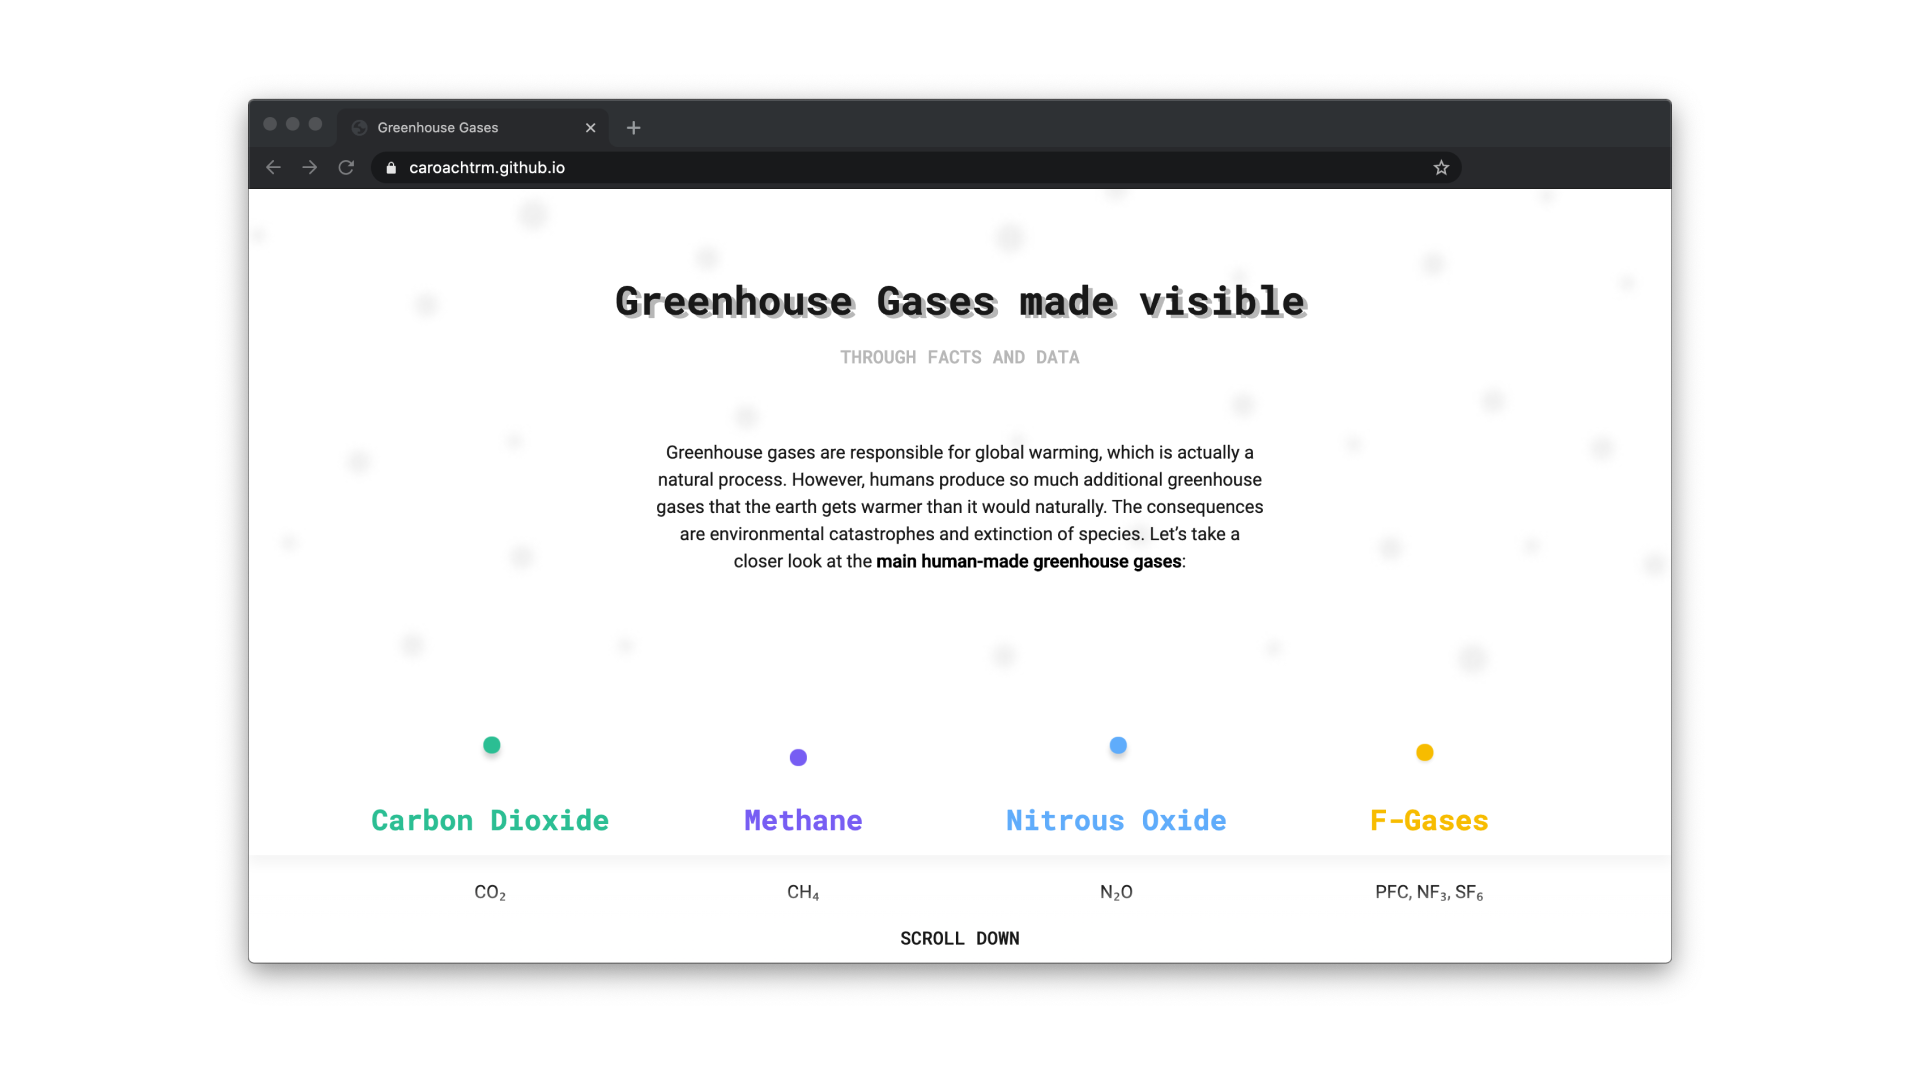
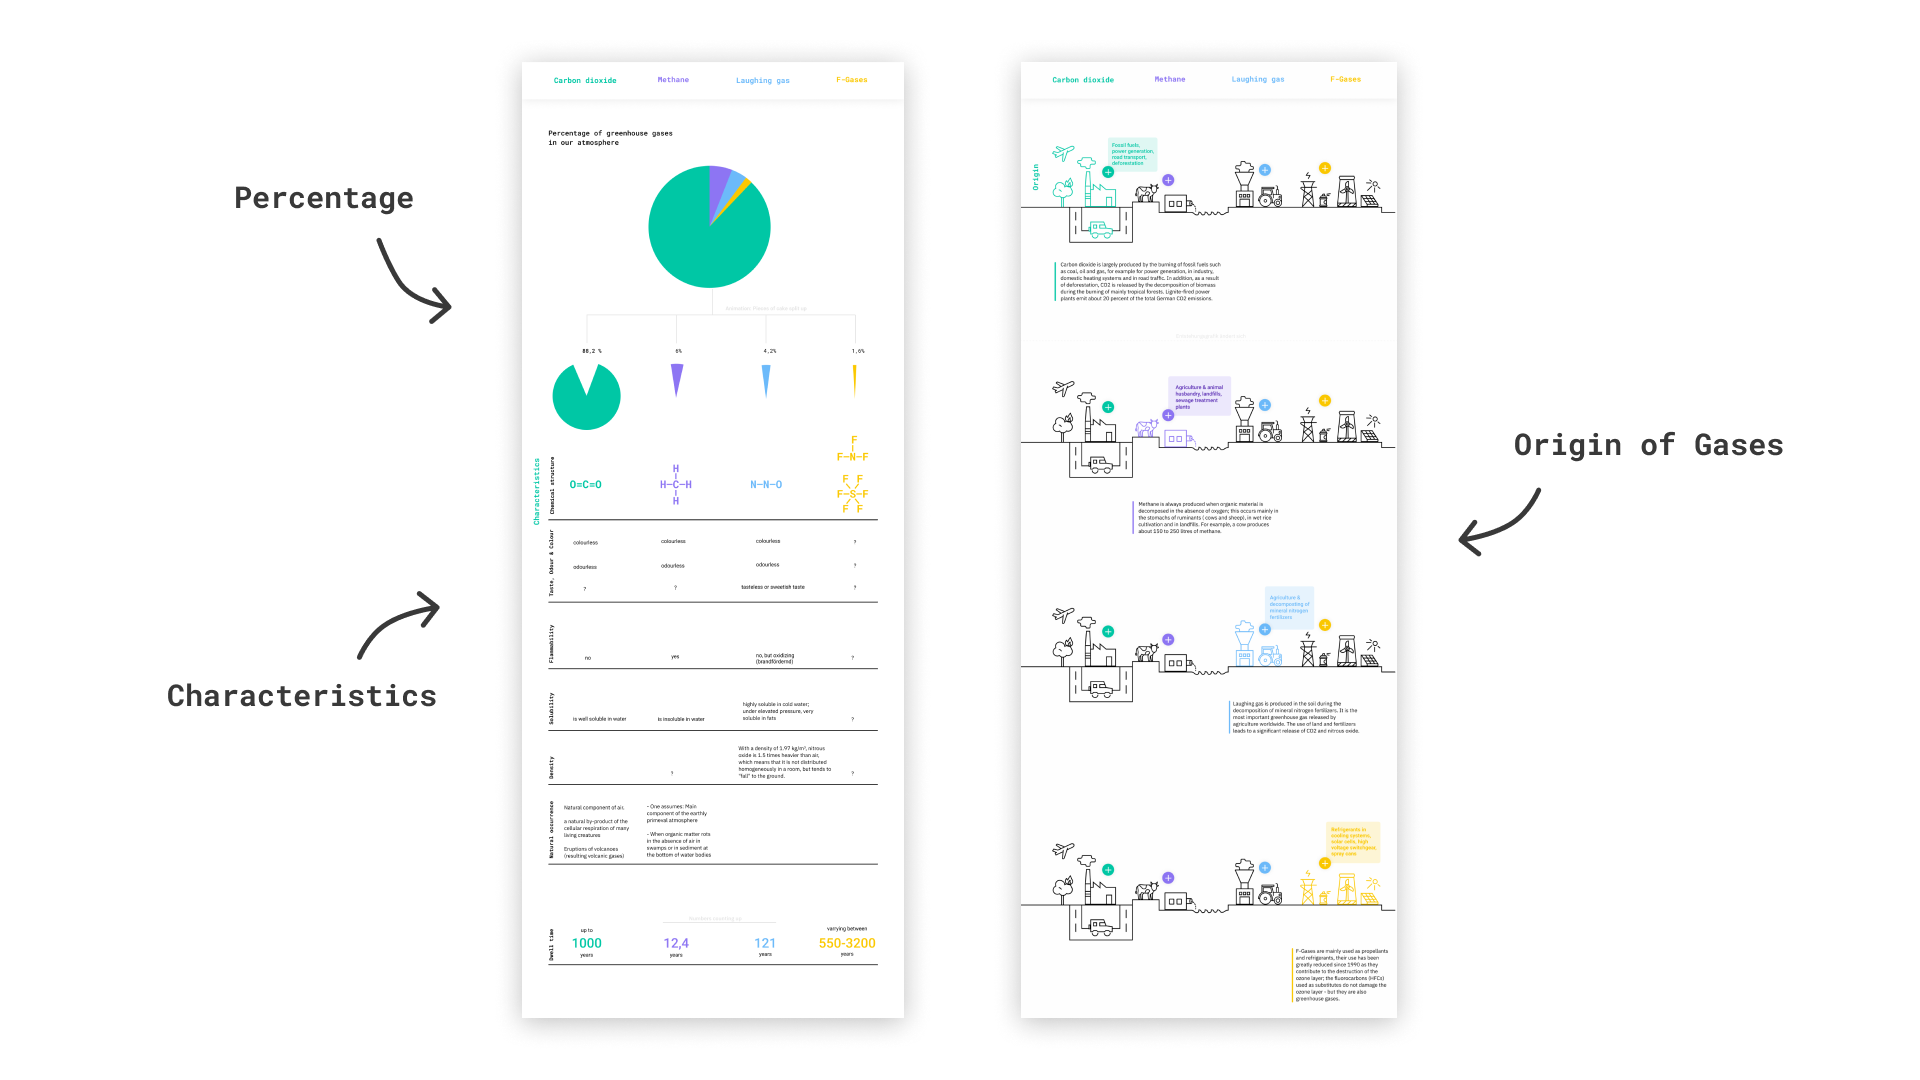
Greenhouse gases are the essence of climate change. They are often mentioned, but not always properly explained. The different characteristics of Carbon Dioxide (CO₂), Methane (CH₄), Nitrous Oxide (N₂O) and F-gases reinforce and speed up climate change in different ways.
The warming of the earth itself through greenhouse gases is a natural process, without which it would be about 33 degrees Celsius colder. However, too many gases cause the earth to heat up more than would actually be expected from solar radiation.
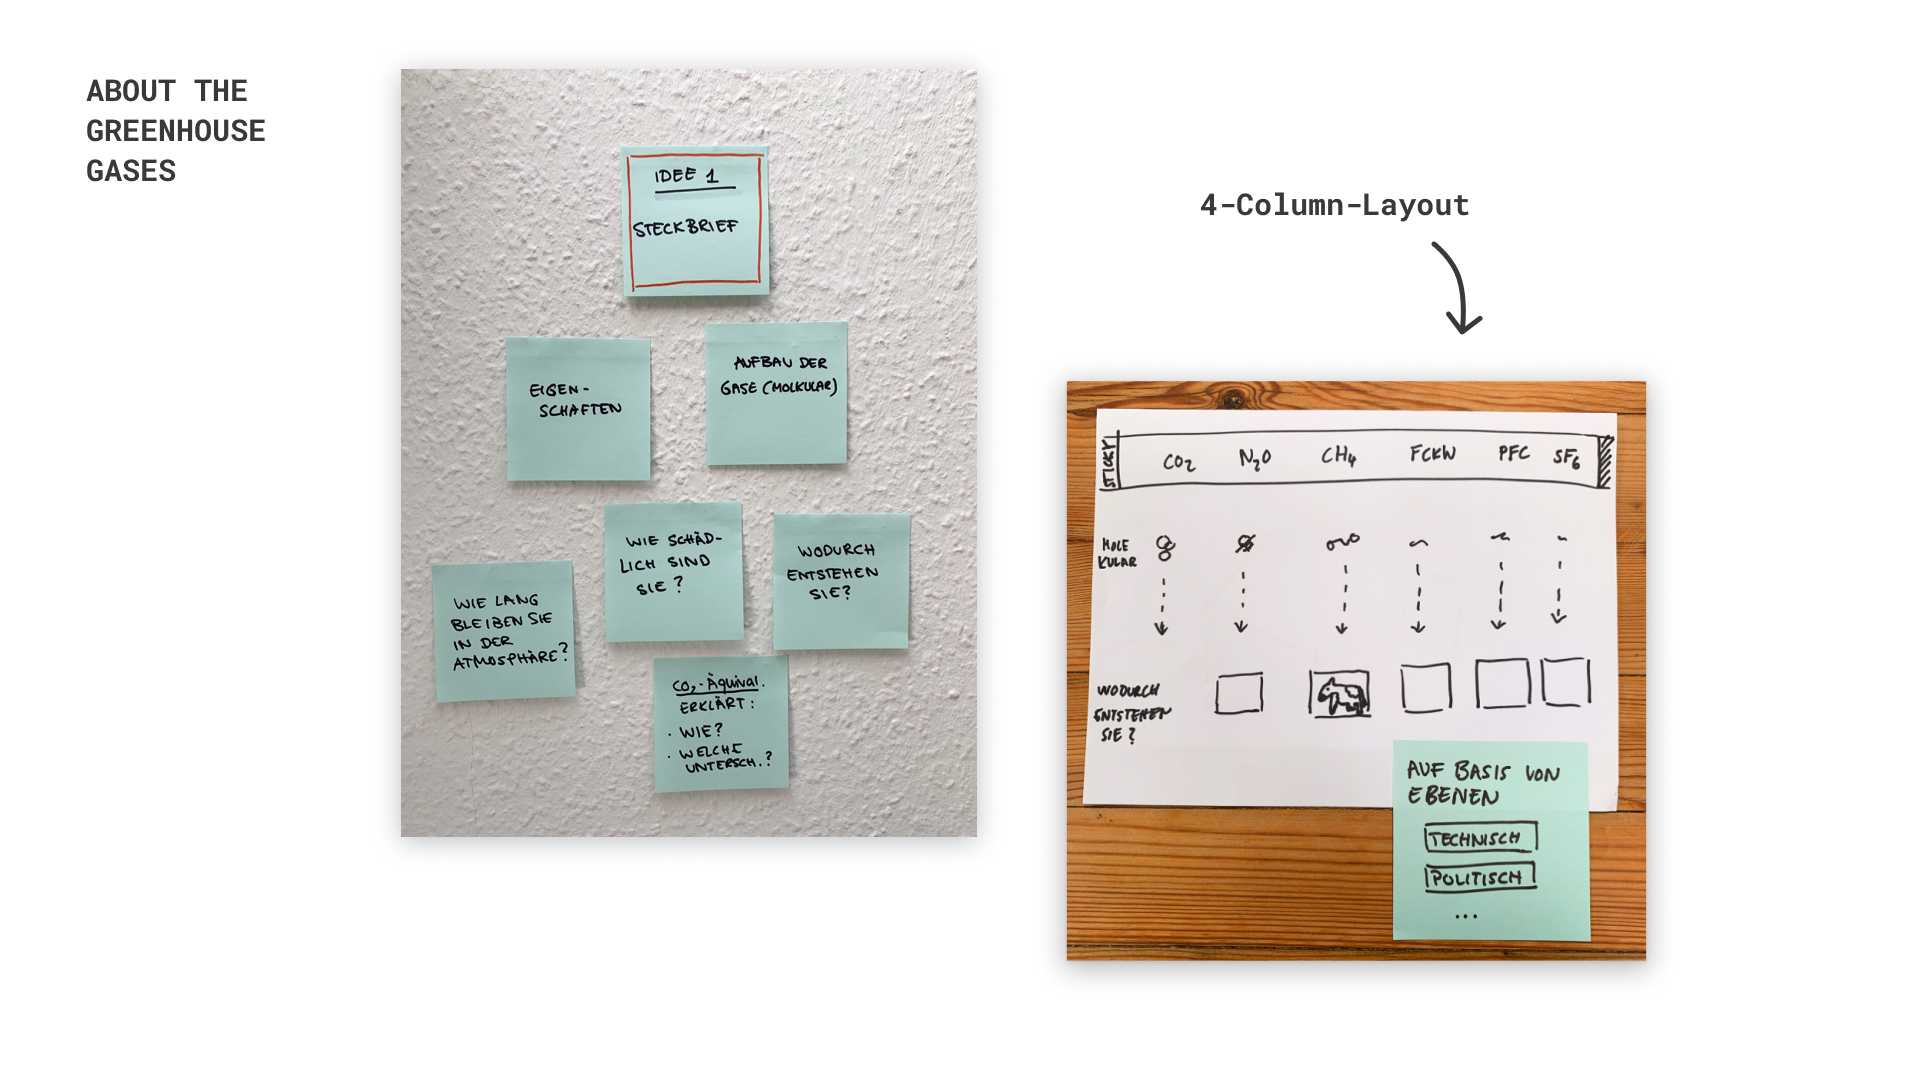
SKETCHES • IDEAS
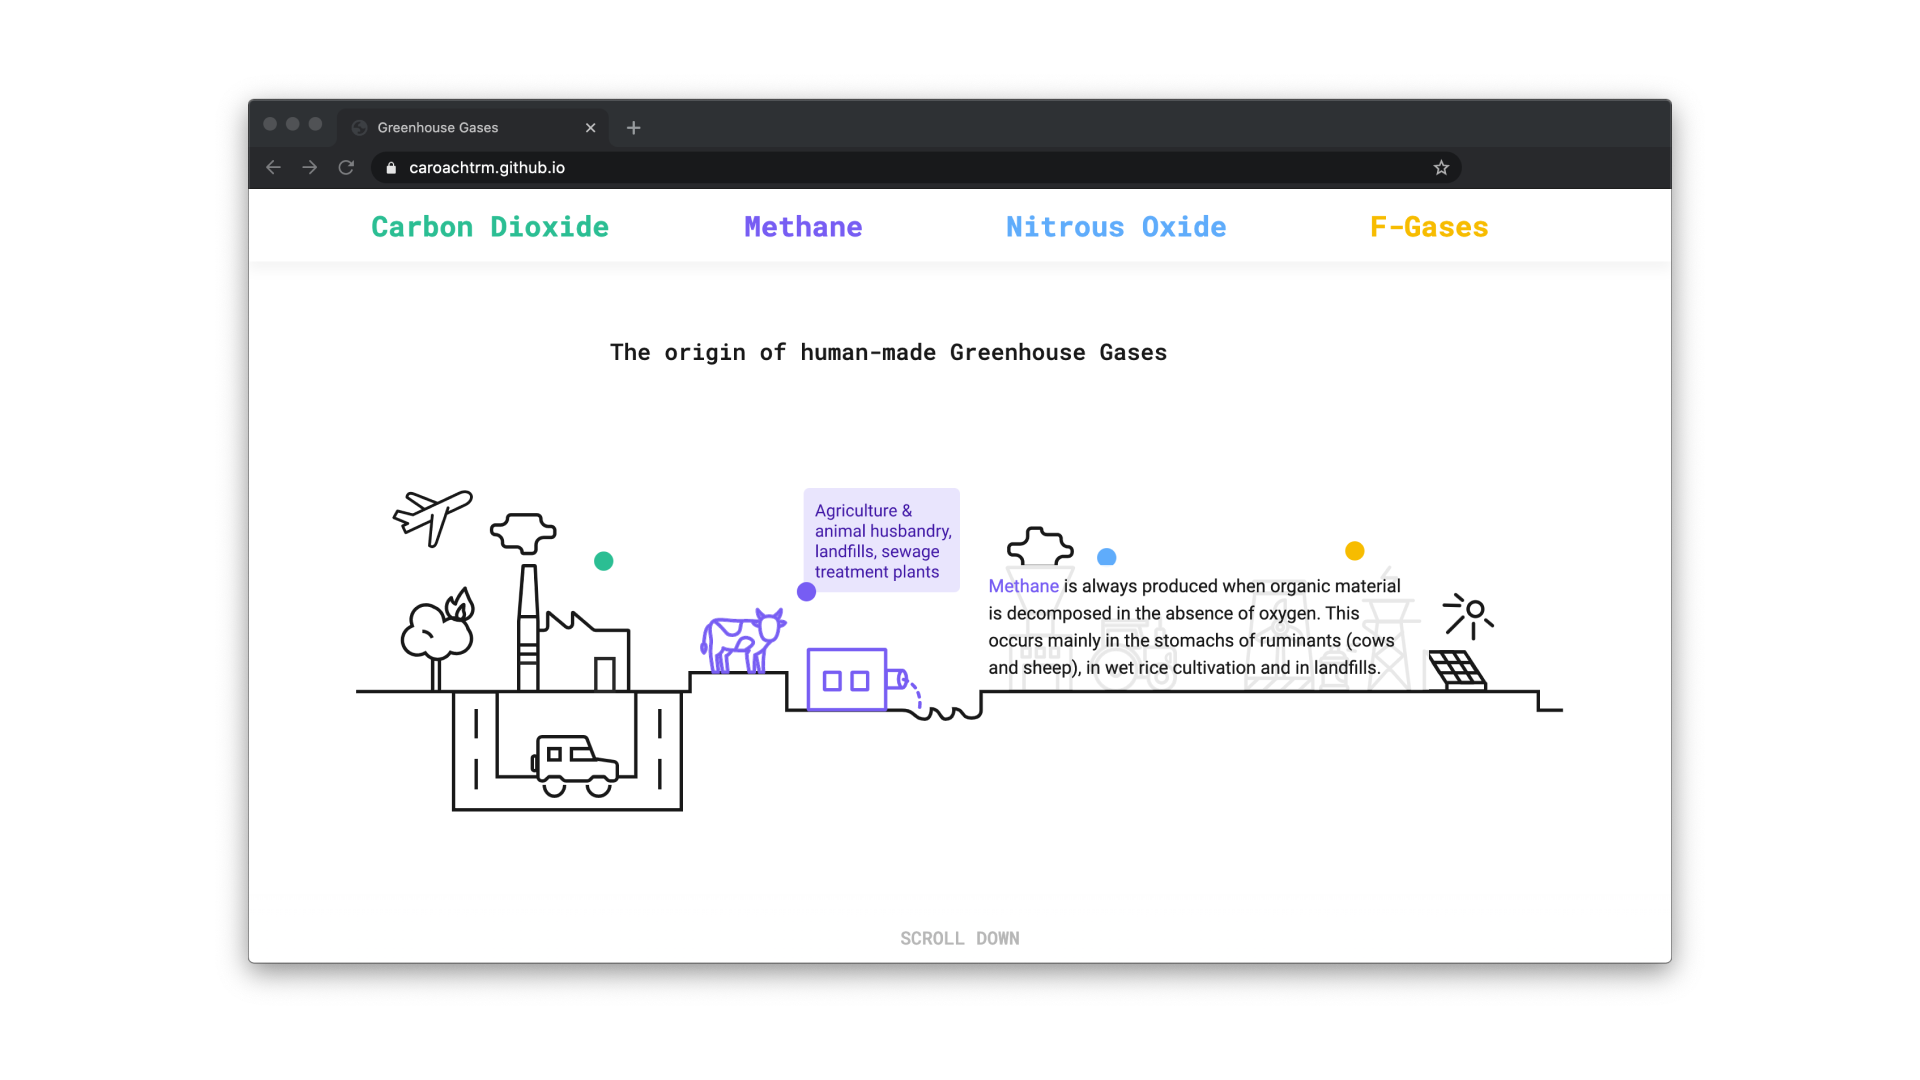
We wanted to show what properties the different gases have, for example how they are produced, how harmful they are for climate change and how long they can remain in the atmosphere.
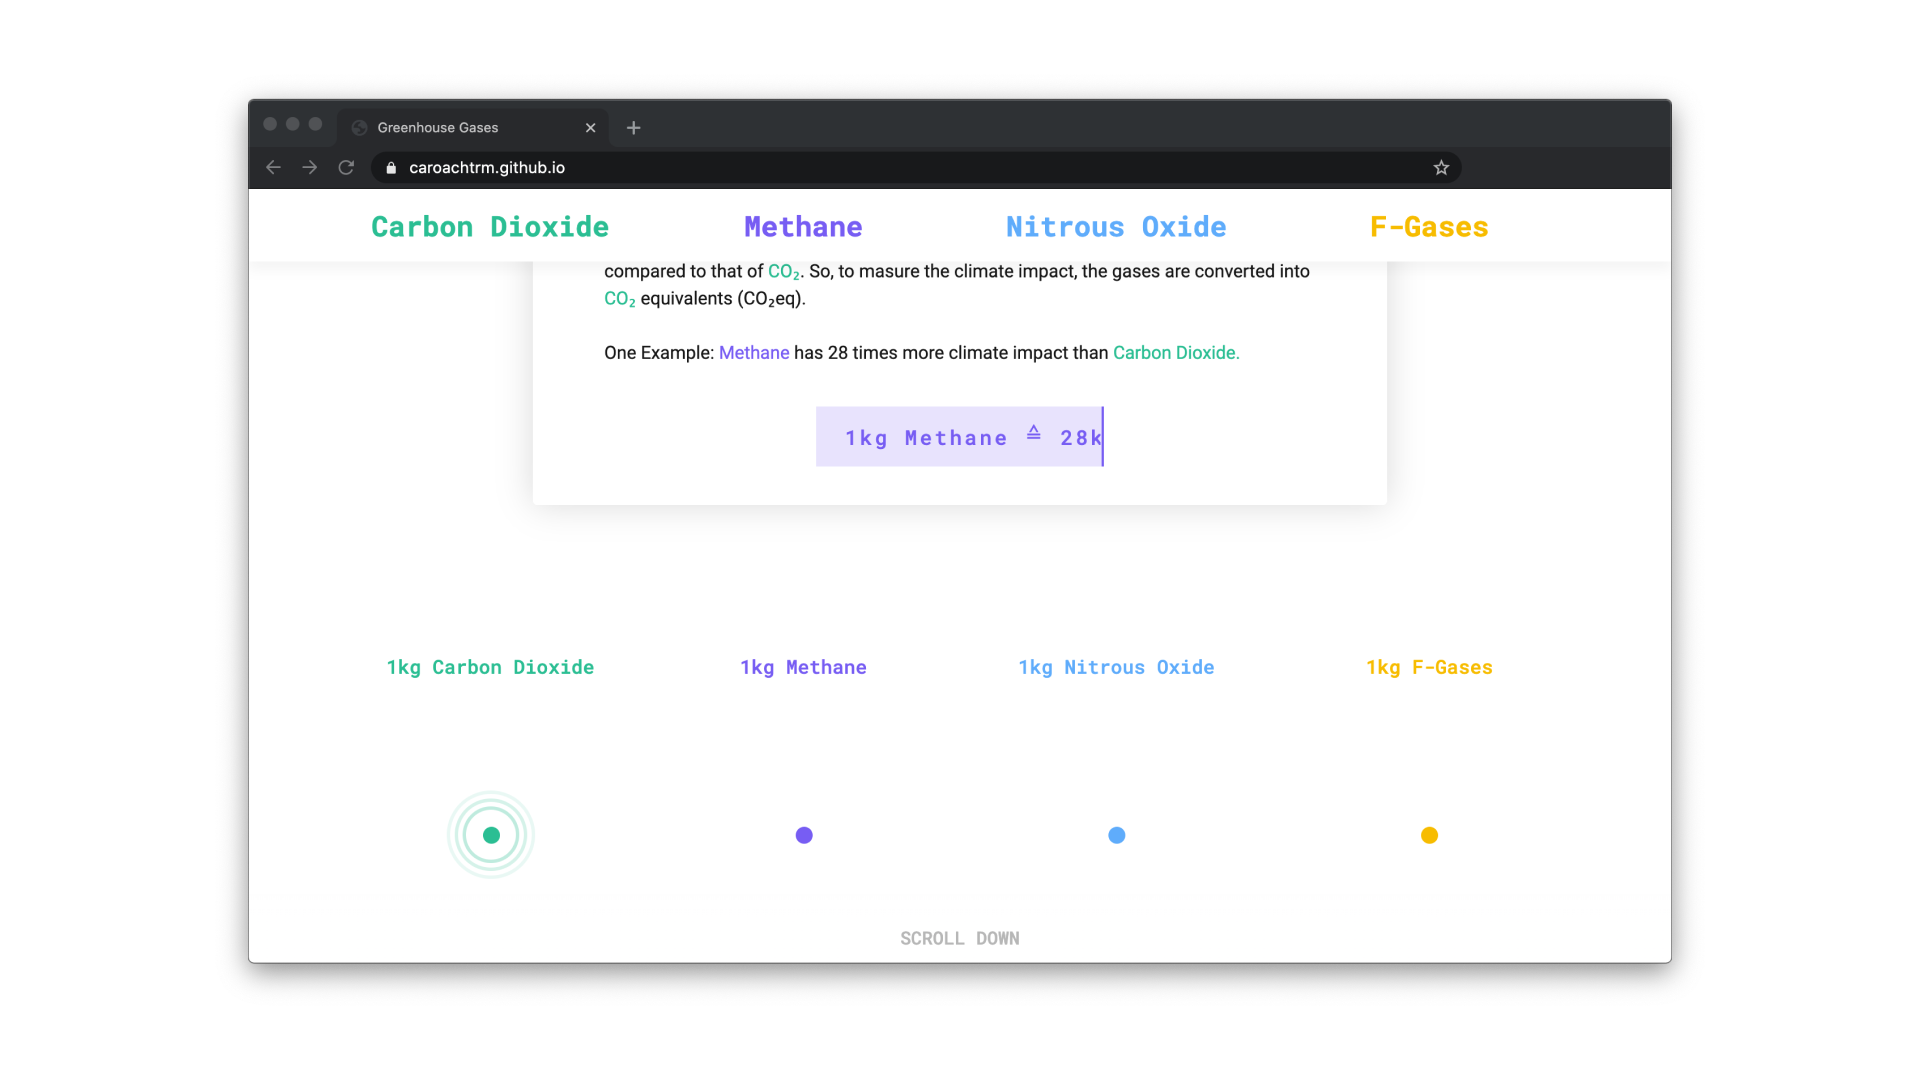
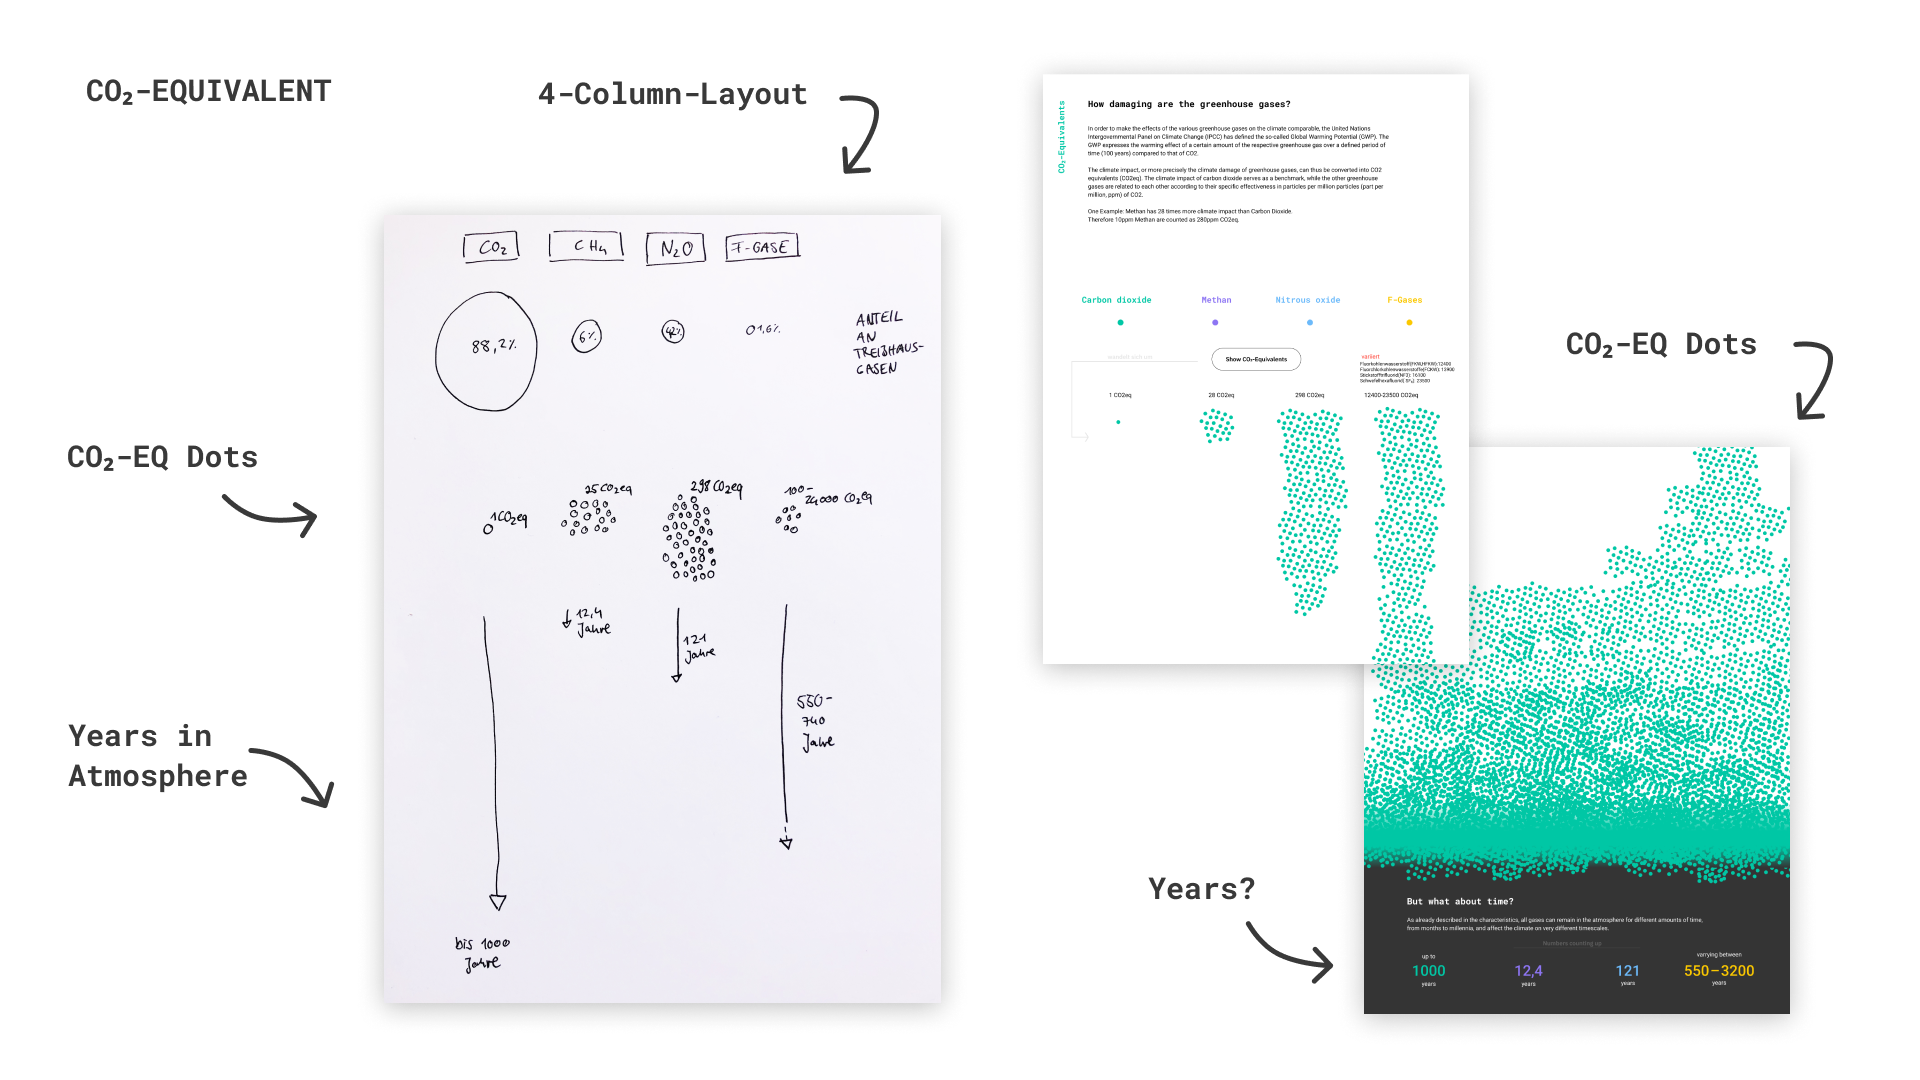
CO₂-Equivalents: In order to be able to compare the global warming potential and how harmful the individual gases are to the climate, they are measured in CO₂-Equivalents (CO₂eq). The climate-damaging effect of carbon dioxide is taken as a benchmark and the other greenhouse gases are related accordingly in particles per million particles (part per million, ppm) CO₂.
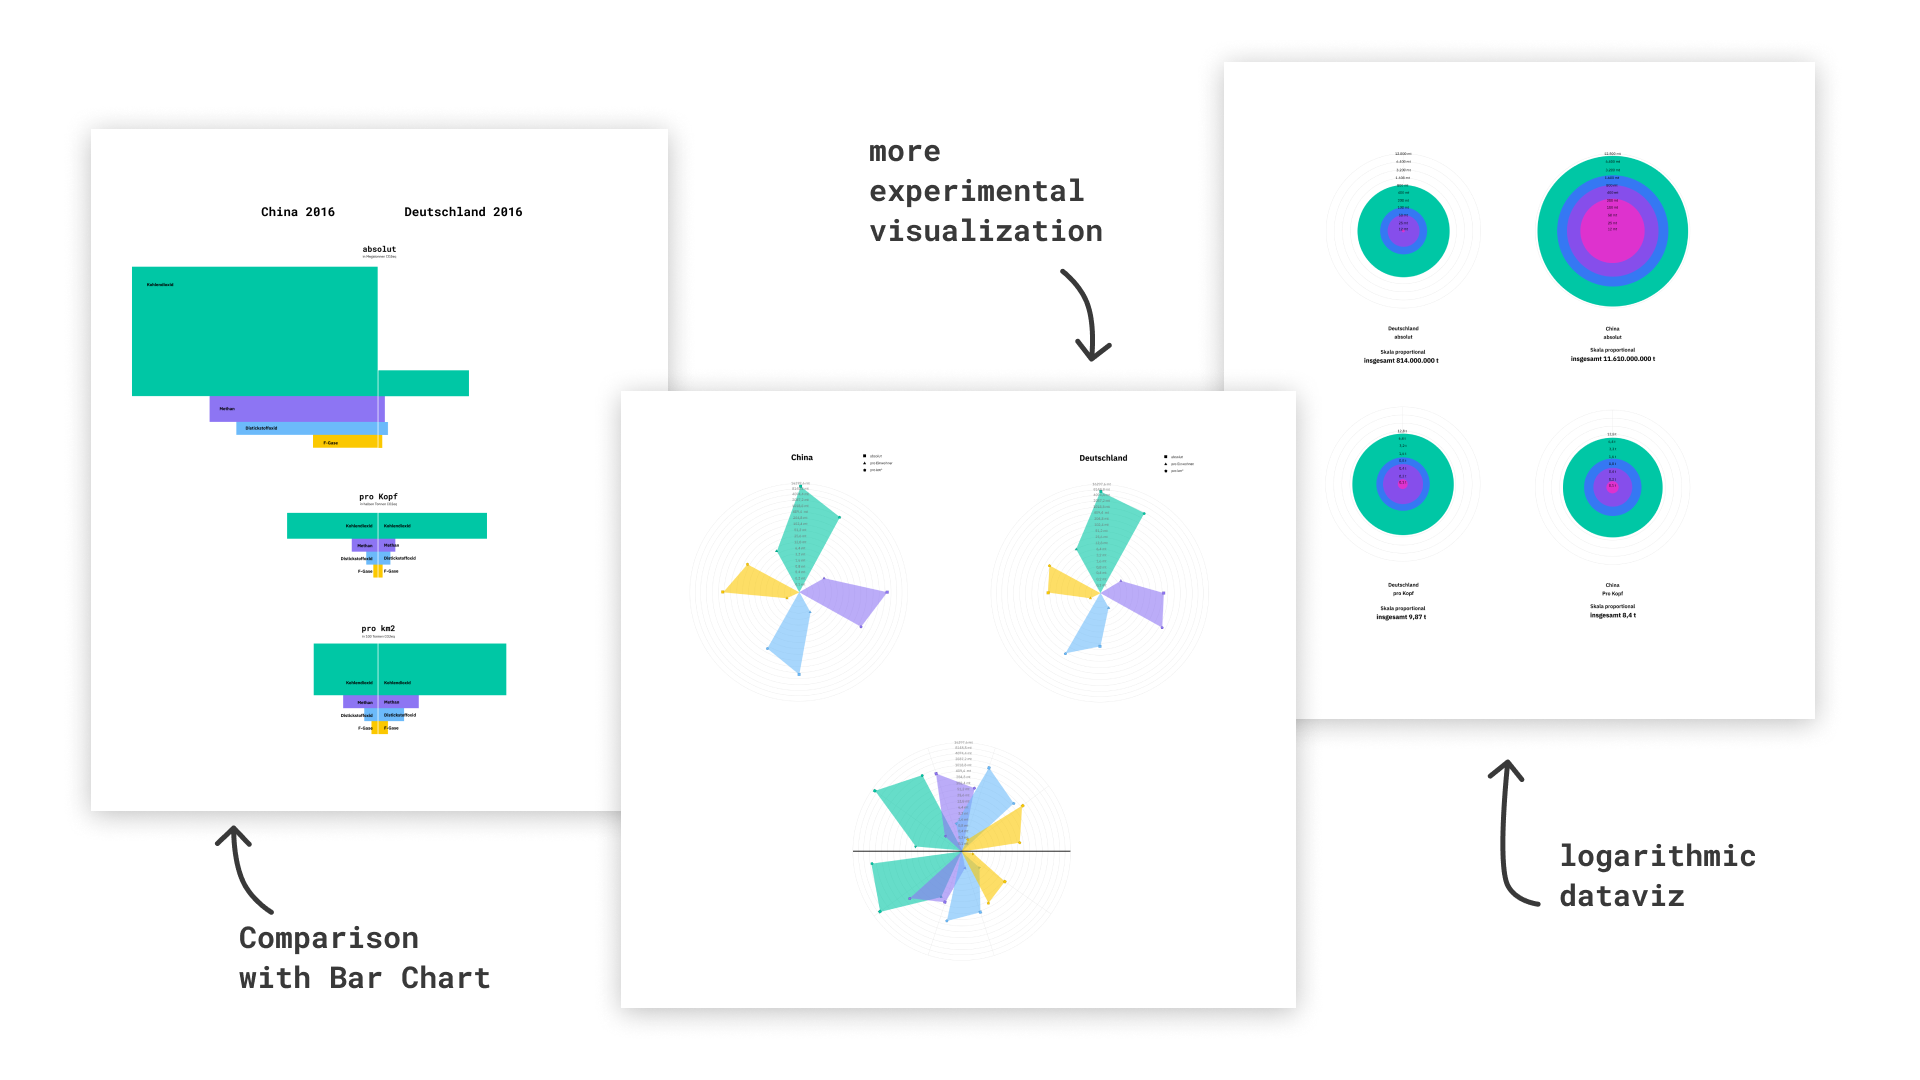
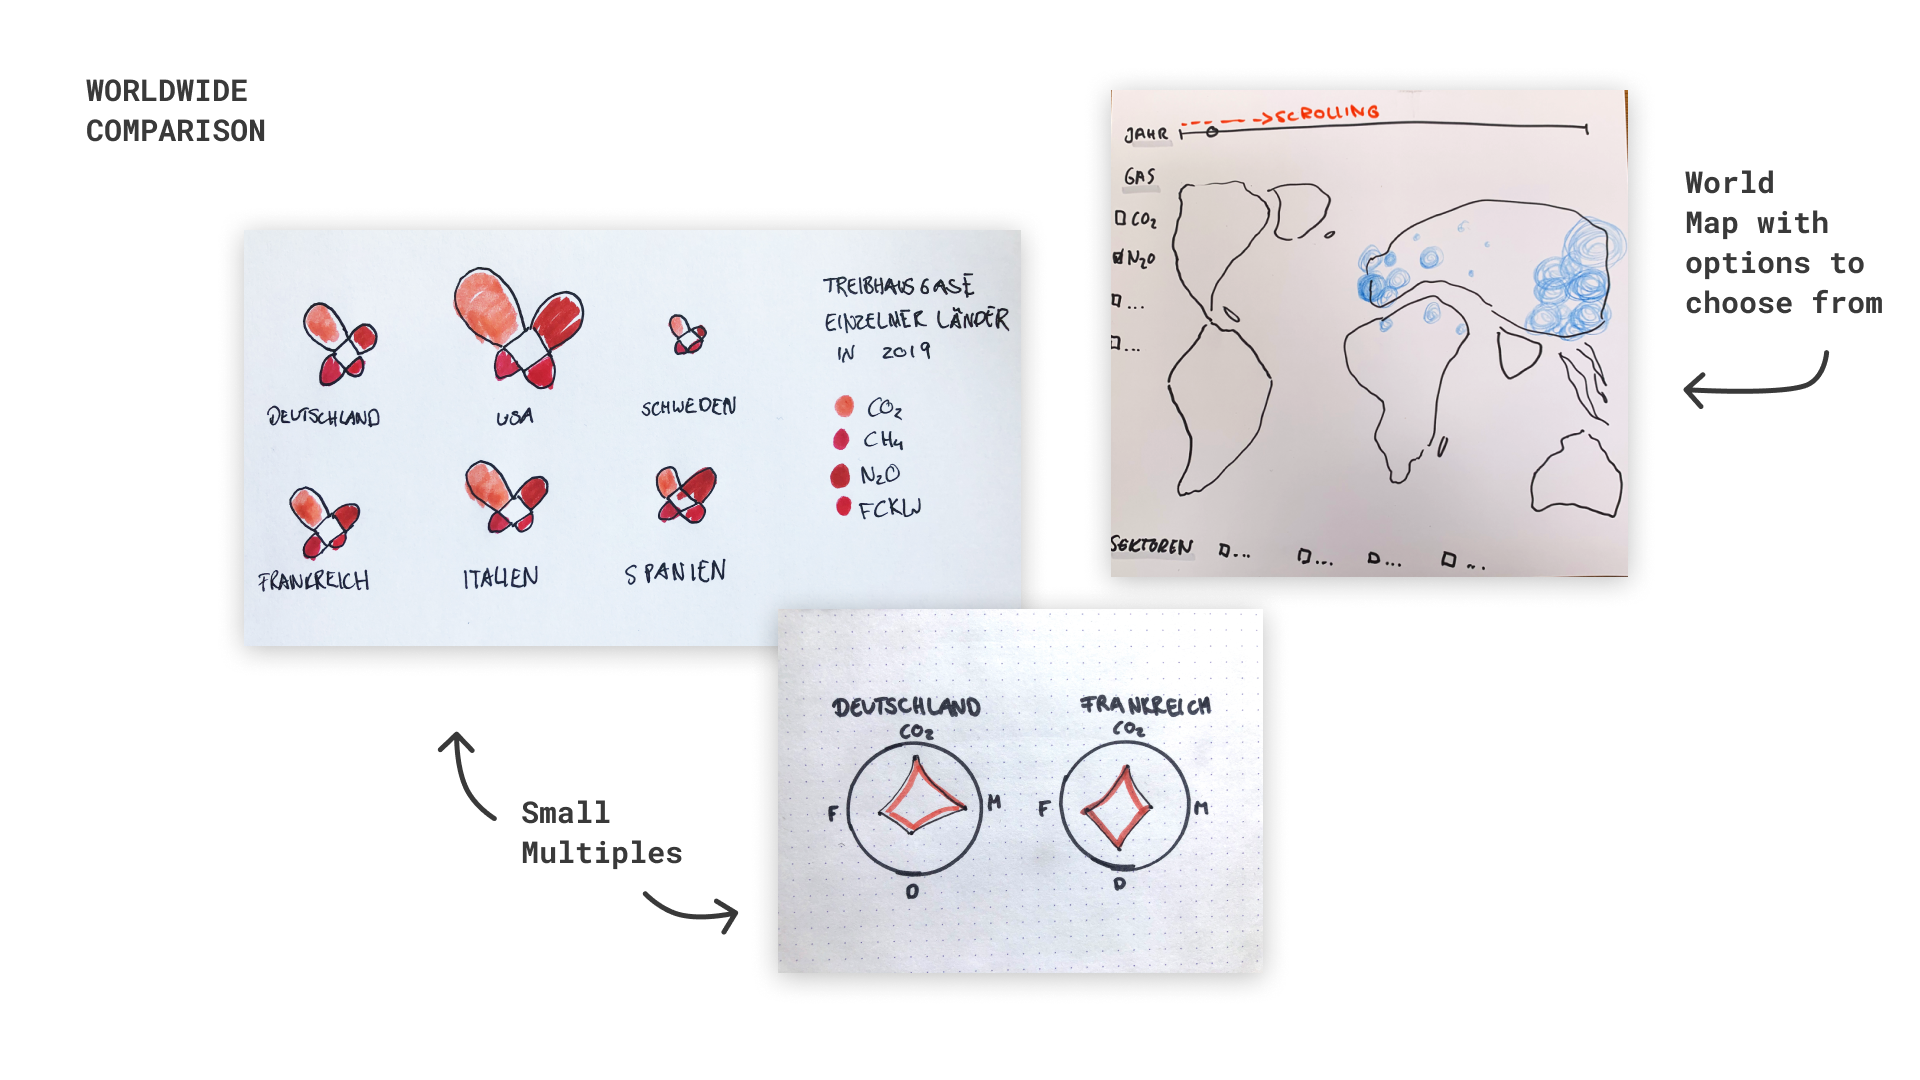
Worldwide Comparison: We also want to break down which countries or continents have produced which type and quantity of greenhouse gases in which years and in which sectors. The idea was for the user to be able to compare the differences between different years, sectors, etc. by adjusting a parameter to change the graph.
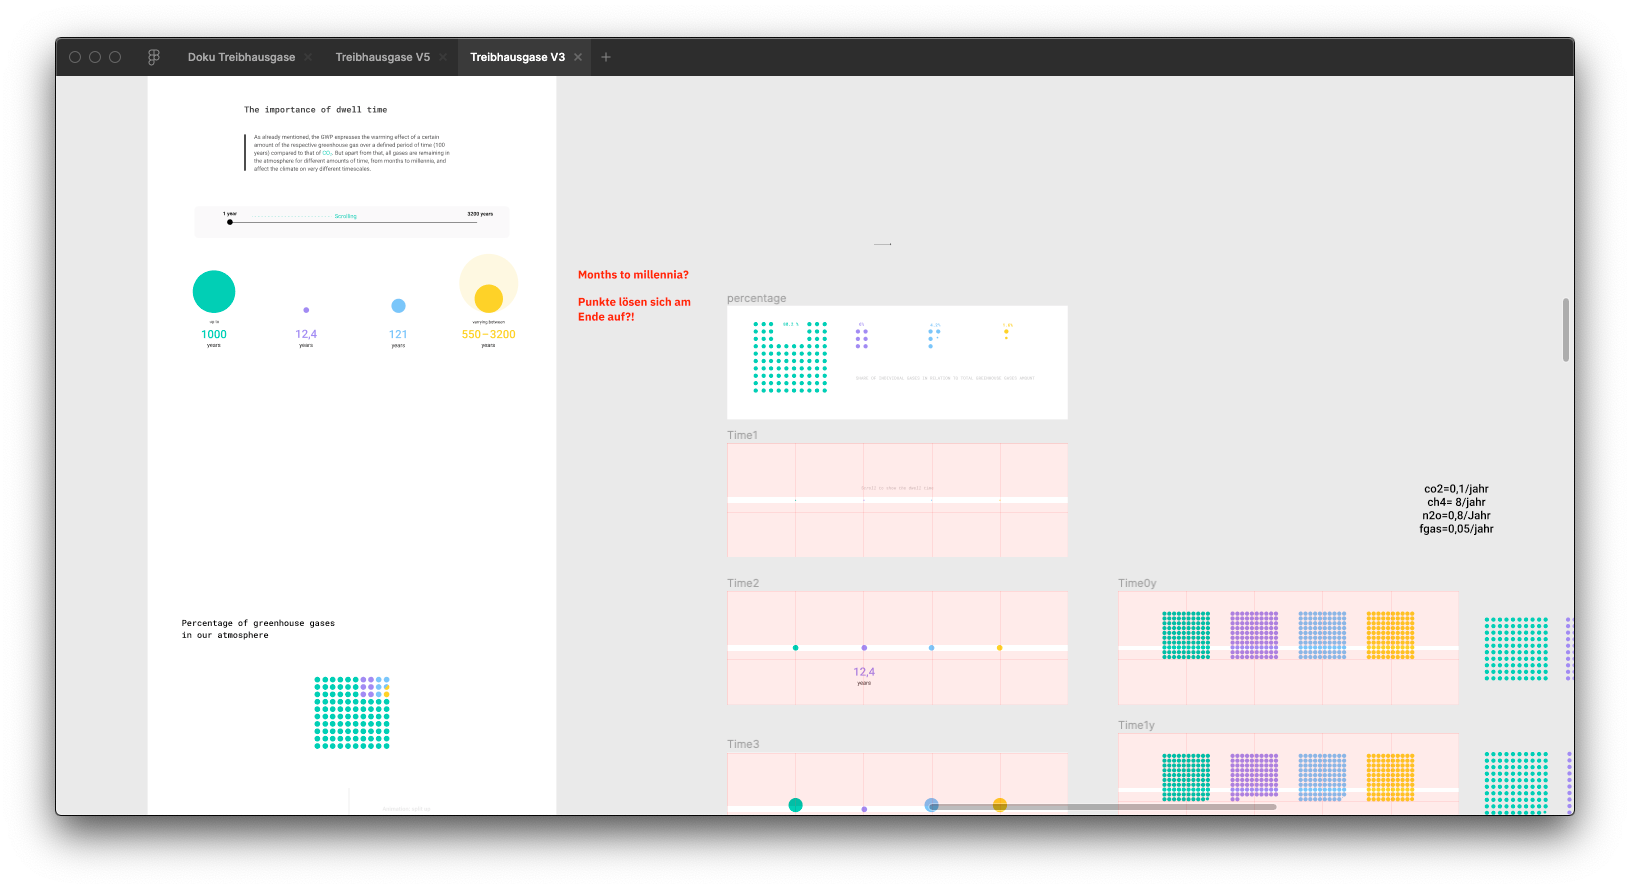
PROCESS
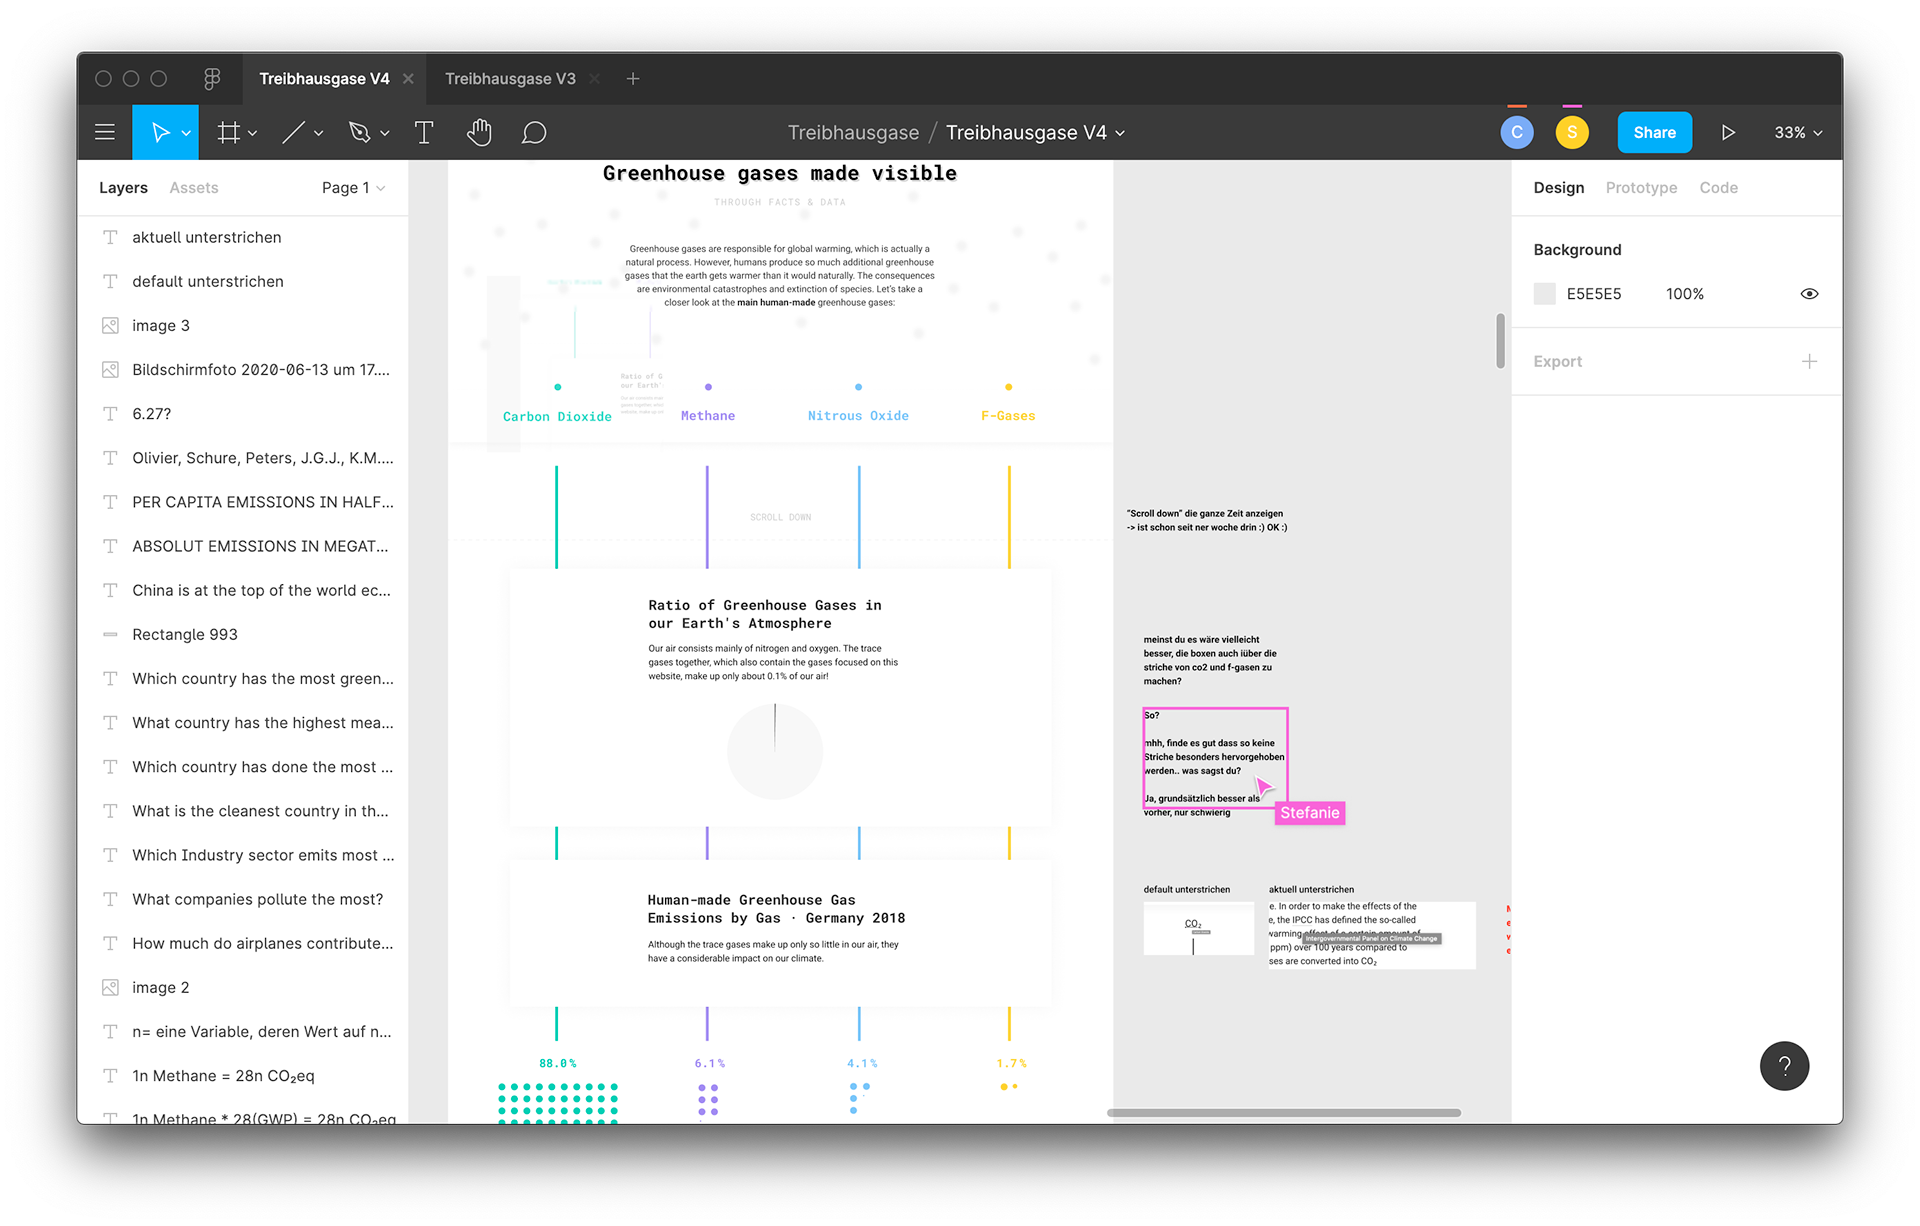
We started by sketching a lot of ideas and visuals for the visualizations and how we could communicate and explain the complexity of the CO₂-Equivalents. Then we built screens and designs in figma. Stefanie created the style guide quite early, having 4 colors for each gas, the Roboto Mono for Headers and the Roboto for texts. We both did research to write all texts and discussed the layout. Finally I started coding the website, using static HTML, CSS and JavaScript. After every coding step I pushed the code to GitHub, from where I also launched the page. In the last 3 weeks of working on the project, we had several design and code iterations to optimize the reading flow.
CONCEPT
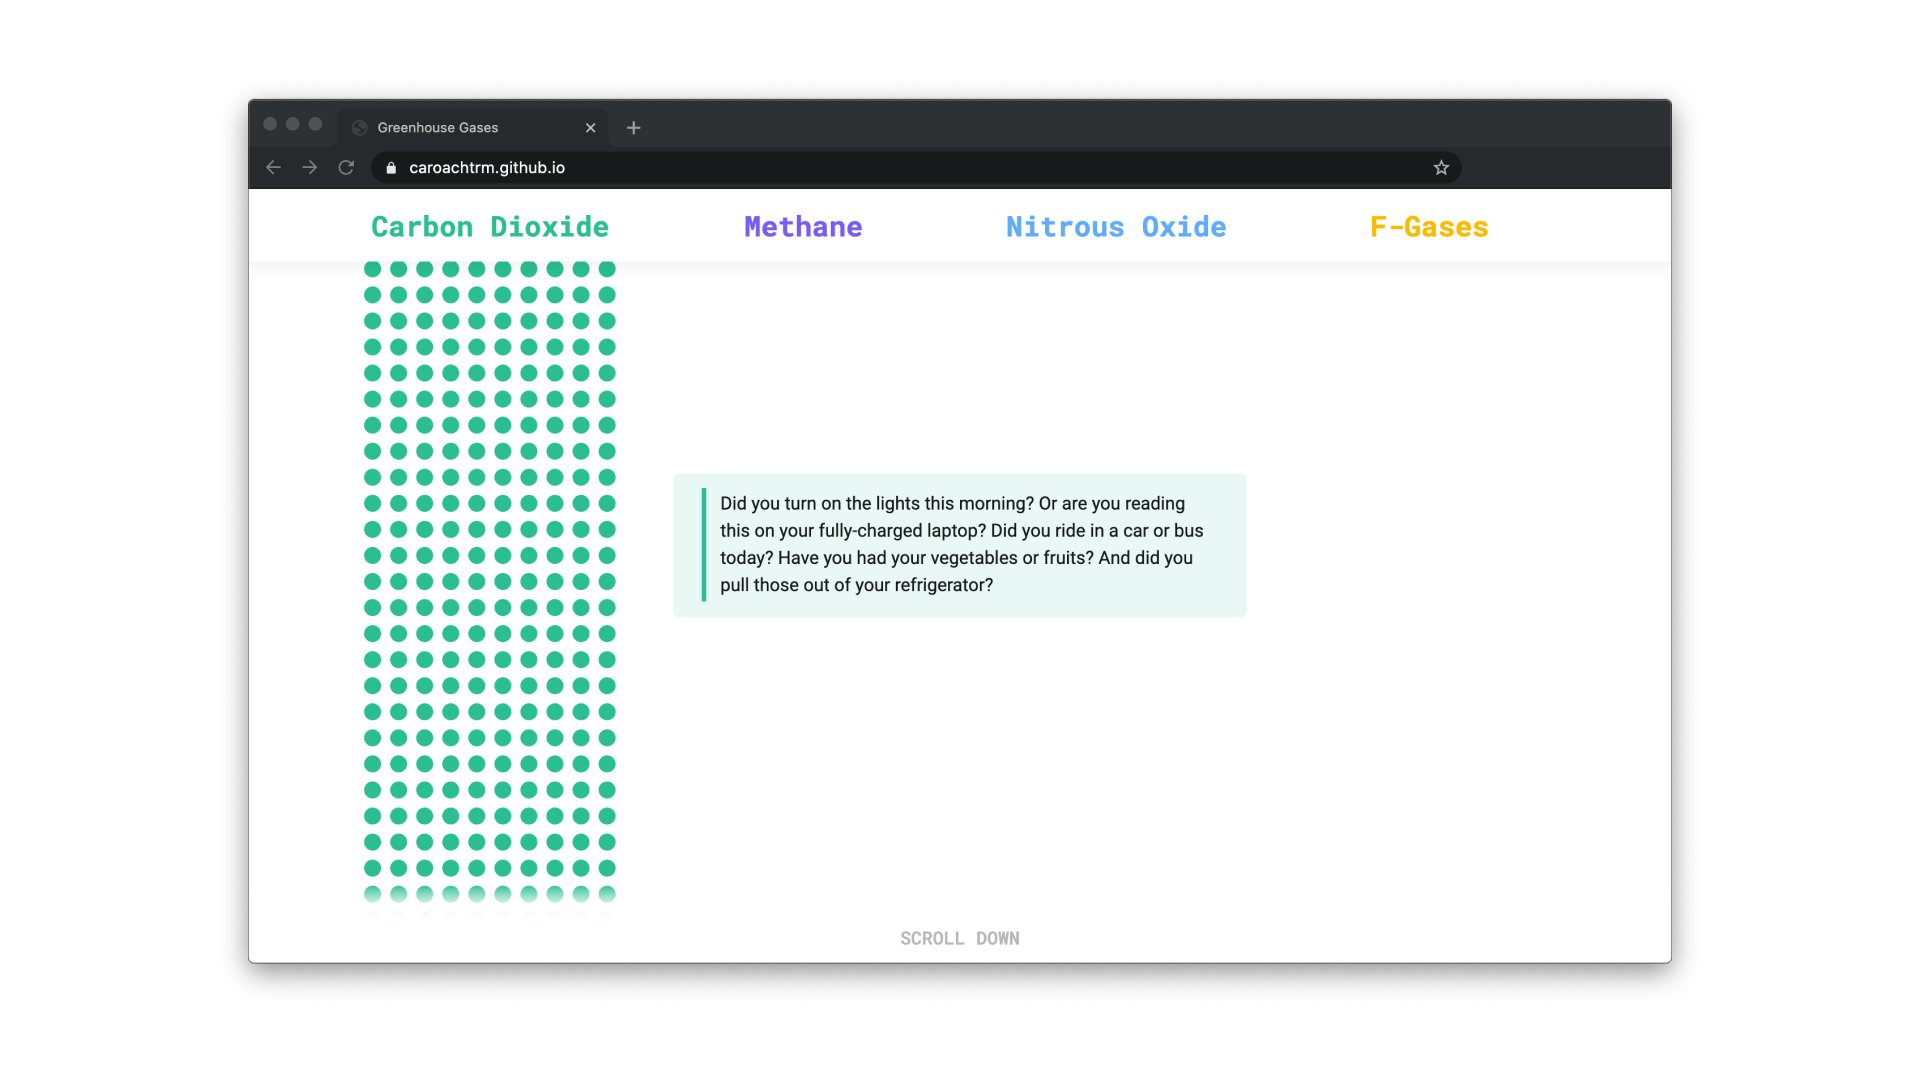
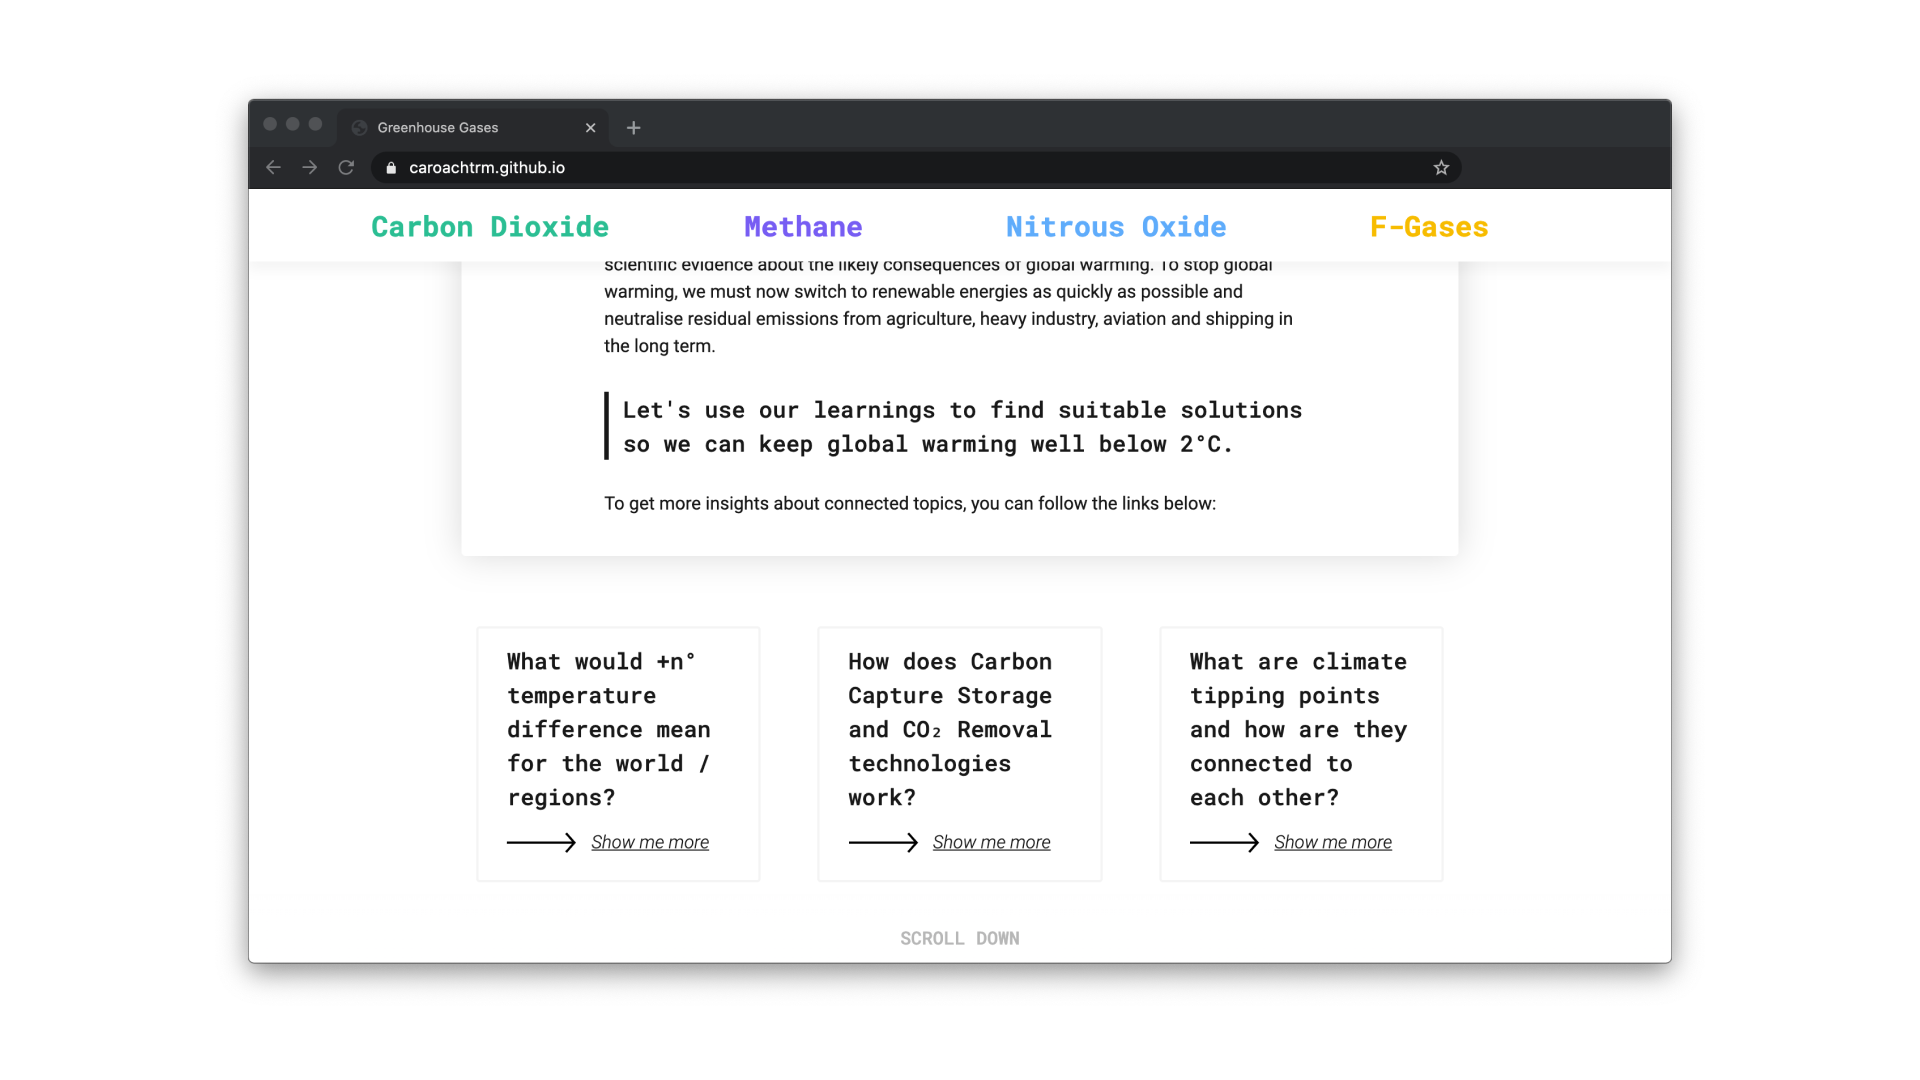
The final Website is a one pager with a few scrollytelling parts, where infovisualizations are animated. The usage of dots is a basis for most of our visualizations, which comes from an early sketch to explain the CO₂-Equivalents. Another main part is the 4-column-layout we are using for the whole website up to the conclusion part. That means we have one column for each gas, a sticky Header shows which gas is represented where on the side and all information about each gas is in this layout.
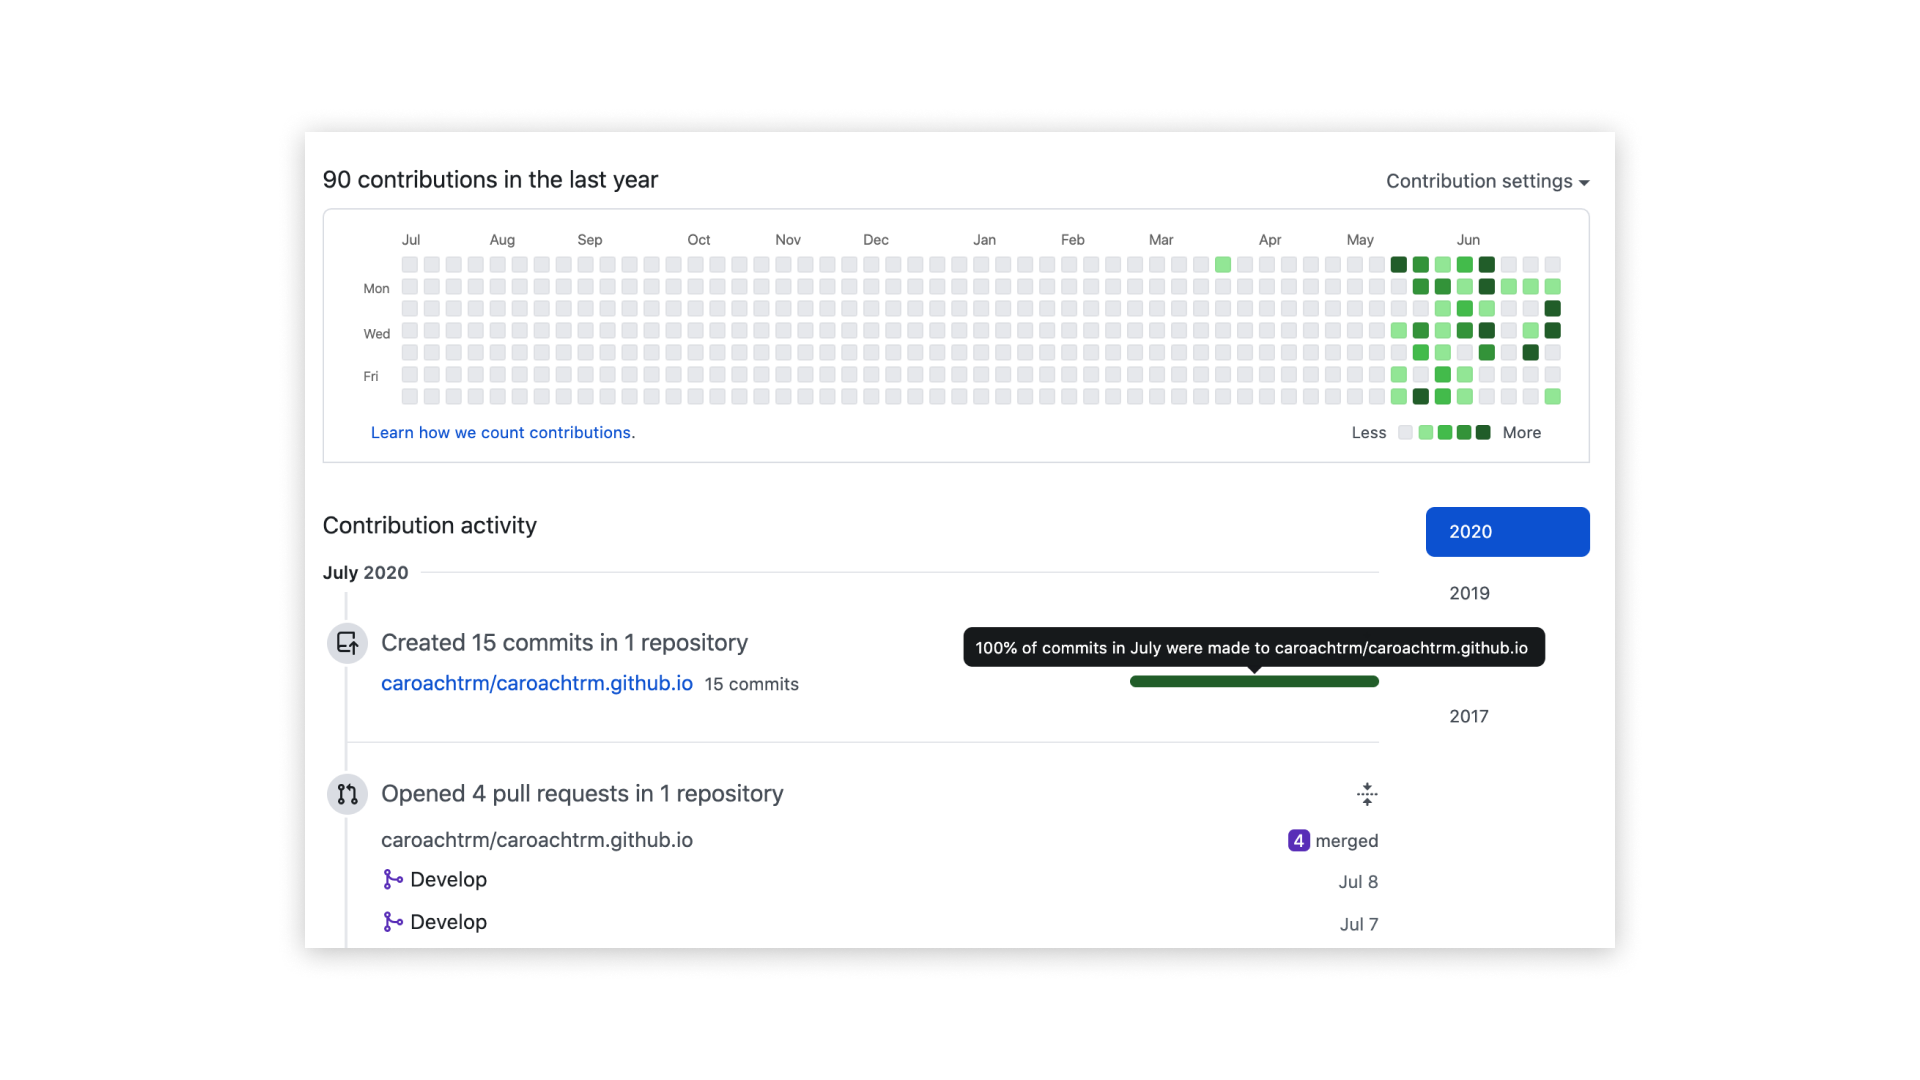
DEVELOPMENT
A few months before this project, I started to learn to code in HTML, CSS and Javascript, because I got the feeling it would be of good use in future projects. So this Website was my first project I coded from the beginning and had to learn everything while creating the website. I decided at the beginning to work with GitHub so that my team, classmates and professors can have a look at the code at any time. Working with GiHub took a bit of time, but was a great decision, because I always could look at the history of code and what I changed when.
FINAL RESULT
To take a look at the final website, click the button below. Note that the website is best displayed in chrome or opera and for the purpose of this project it is non-responsive.